Performance Data
St John's Catholic Primary School SATs results
Pupil Outcomes 2025-2026
|
St John's Catholic Primary School Key Stage 2 Results |
% of pupils | National % 2026 | |||
| Percentage of children who achieved the expected standard in reading | 81 | 75 | |||
| Percentage of children who achieved the expected standard in maths | 81 | 75 | |||
| Percentage of children who achieved the expected standard in writing | 85.1 | 60.2 | |||
| Percentage of children who achieved the expected standard in gps | 81.8 | 73.7 | |||
| Percentage of children who achieved the higher standard in reading | 41.3 | 31 | |||
| Percentage of children who achieved the higher standard in maths | 38.8 | 27 | |||
| Percentage of children who achieved the higher standard in writing | 27.3 | 13.2 | |||
| Percentage of children who achieved the higher standard in gps | 42.1 | 30.2 | |||
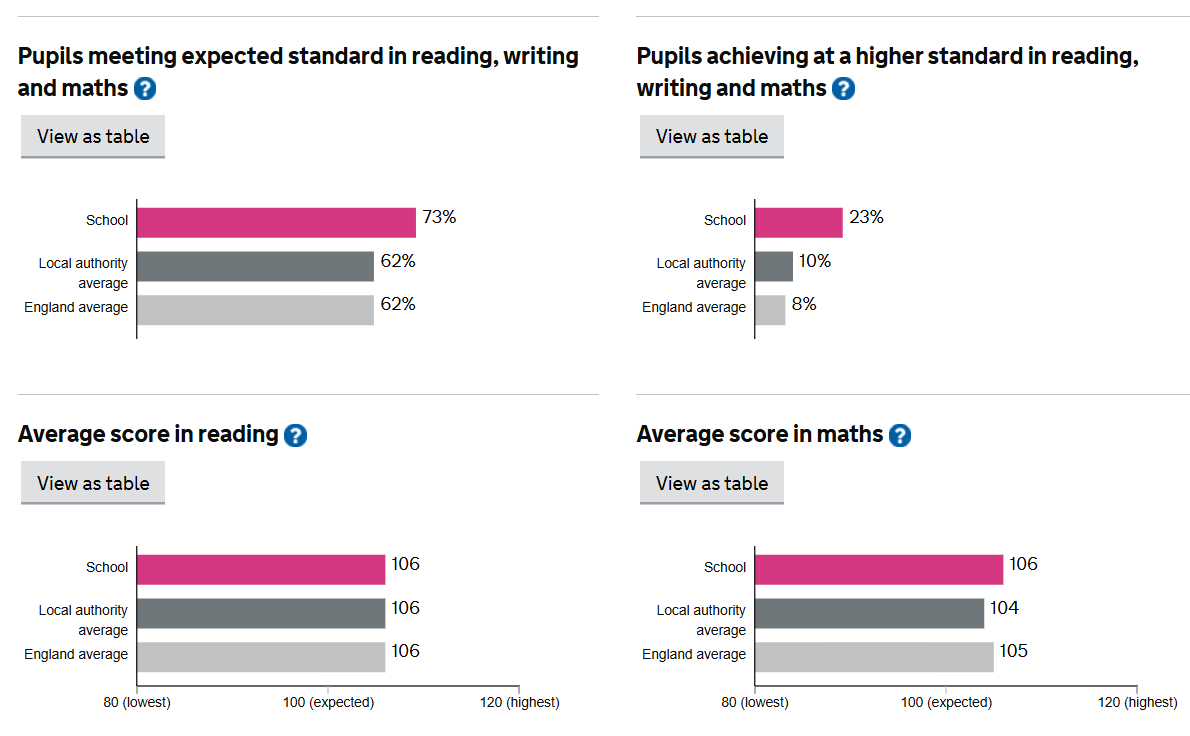
| Percentage of children who achieved the expected standard in reading, writing and maths | 72.7 | 63.2 | |||
| Percentage of children who achieved the higher standard in reading, writing and maths | 20.7 | 8.6 | |||
| Pupils' average scaled score in the reading test | 106.9 | 105.7 | |||
| Pupils' average scaled score in the maths test | 106.6 | 104.9 | |||
Pupil Outcomes 2024-2025
|
St John's Catholic Primary School Key stage 2 results |
% of pupils | National % 2025 | |||
| Percentage of children who achieved the expected standard in reading | 76.7 | 75 | |||
| Percentage of children who achieved the expected standards in mathematics | 83.3 | 74.1 | |||
| Percentage of children who achieved the expected standard in writing | 85.8 | 72.2 | |||
| Percentage of children who achieved the expected standard in gps | 78.3 | 72.6 | |||
| Percentage of children who achieved the higher standard in reading | 40.8 | 33.3 | |||
| Percentage of children who achieved the higher standard in mathematics | 32.5 | 26.2 | |||
| Percentage of children who achieved the higher standard in writing | 30 | 12.7 | |||
| Percentage of children who achieved the higher standard in gps | 33.3 | 29.4 | |||
| Pecentage of children who achieved the expected standard in reading, writing and maths | 73.3 | 62.1 | |||
| Percentage of chidlren who achieved the higher standard in reading, writing and maths | 22.5 | 8.3 | |||
| Pupils' average scaled score in the reading test | 106.3 | 105.6 | |||
| Pupils' average scaled score in the maths test | 105.9 | 10-4.7 | |||
The following information relates to Key Stage 2 data for the school year 2022/2023 (due to COVID, there was no national results published for years 2019/2020 or 2020/2021).
Pupil Outcomes 2022-23
|
St John’s Catholic Primary School Key Stage Two results |
% of pupils |
National % 2023 |
| Percentage of children who achieved the expected standard in reading |
78 |
73 |
| Percentage of children who achieved the expected standard in mathematics | 80 | 73 |
| Percentage of children who achieved the expected standard in writing | 86 | 71 |
| Percentage of children who achieved the expected standard in gps | 81 | 72 |
| Percentage of children who achieved a higher standard in reading | 35 | 29 |
| Percentage of children who achieved a higher standard in mathematics | 30 | 24 |
| Percentage of children who achieved a higher standard in writing | 13 | 13 |
| Percentage of children who achieved a higher standard in gps | 35 | 30 |
|
Percentage of pupils who achieved the expected standard in reading, writing and maths |
71 |
59 |
|
Percentage of pupils achieving a higher standard in reading, writing and maths |
7 |
8 |
|
Pupils’ average scaled score in the reading test |
106 |
105 |
|
Pupils’ average scaled score in the maths test |
105 |
104 |
|
Average progress that pupils have made in reading between KS1 and KS2 |
0.9 |
0 |
|
Average progress that pupils have made in writing between KS1 and KS2 (confidence interval in brackets) |
0.9 |
0 |
|
Average progress that pupils have made in maths between KS1 and KS2 (confidence interval in brackets) |
1.8 |
0 |
Performance Tables
Please click the link below for school performance data:
Department of Education School performance table